Adding a Dashboard with charts
A personal finance application isn’t complete without a way to visualize your financial health at a glance. In this lesson, we will build a dynamic dashboard with widgets to track our balance, improvements, and budget usage. We’ll also implement global date filtering and add a dedicated Charts page.
The Stats Overview Widget
Filament allows you to build dynamic dashboards comprised of “widgets”. Each widget is an element on the dashboard that displays data in a specific way, such as stats, charts, or tables.
Let’s start by creating a “Stats Overview” widget to display our total balance, income, expenses, and cash flow.
Run the following command:
php artisan make:filament-widget StatsOverview --stats-overviewThis creates a new widget class in app/Filament/Widgets/StatsOverview.php. We want to modify the getStats method to calculate our financial metrics.
// app/Filament/Widgets/StatsOverview.php

protected function getStats(): array
{
    // ... logic to fetch stats ...

    return [
        Stat::make('Total Balance', Number::currency($totalBalance, 'EUR', 'en')),
        Stat::make('Expenses', Number::currency($expenses, 'EUR', 'en')),
        Stat::make('Incomes', Number::currency($incomes, 'EUR', 'en')),
        Stat::make('Cash Flow', Number::currency($cashFlow, 'EUR', 'en')),
    ];
}
We use Laravel’s Number::currency helper to properly format the monetary values.
Custom Dashboard with Filters
By default, Filament provides a simple dashboard. However, we want to be able to filter our statistics by date ranges (e.g., “Last Month”, “Last Year”). To do this, we need to replace the default Dashboard with a custom one that supports filters.
Create a new page for the Dashboard:
// app/Filament/Pages/Dashboard.php

namespace App\Filament\Pages;

use Filament\Pages\Dashboard as BaseDashboard;
use Filament\Pages\Dashboard\Concerns\HasFiltersForm;
// ... imports

class Dashboard extends BaseDashboard
{
    use HasFiltersForm;

    public function filtersForm(Schema $schema): Schema
    {
        return $schema
            ->components([
                Section::make()
                    ->components([
                        DatePicker::make('startDate')->live(),
                        DatePicker::make('endDate')->live(),
                        // ... actions for quick selection
                    ])
                    ->columns(2),
            ]);
    }
}
We also added quick actions to easily select “Last Week”, “Last Month”, etc. You can see the full implementation of the dashboard and filters in this commit.
Connecting Widgets to Filters
Now that we have filters on the dashboard, we need our widgets to react to them. We do this by using the InteractsWithPageFilters trait in our StatsOverview widget.
// app/Filament/Widgets/StatsOverview.php

use Filament\Widgets\Concerns\InteractsWithPageFilters; // [!code ++]

class StatsOverview extends StatsOverviewWidget
{
    use InteractsWithPageFilters; // [!code ++]

    protected function getStats(): array
    {
        $startDate = $this->filters['startDate'] ?? null;
        $endDate = $this->filters['endDate'] ?? null;

        // Apply filters to your queries
        $transactions = Transaction::where('user_id', auth()->id())
            ->when($startDate, fn ($query) => $query->whereDate('date', '>=', $startDate))
            ->when($endDate, fn ($query) => $query->whereDate('date', '<=', $endDate))
            ->get();

        // ...
    }
}
With this change, the stats will automatically update when you change the dates on the dashboard.
Budget Usage Widget
Next, let’s visualize our budget usage. We want to see how much of each budget we’ve spent and what remains.
We’ll create a BudgetsOverview widget:
php artisan make:filament-widget BudgetsOverview --stats-overviewIn this widget, we’ll iterate through our budgets and calculate the spending percentage for the selected period. We can also customize the appearance with colors and charts to show progress bars.
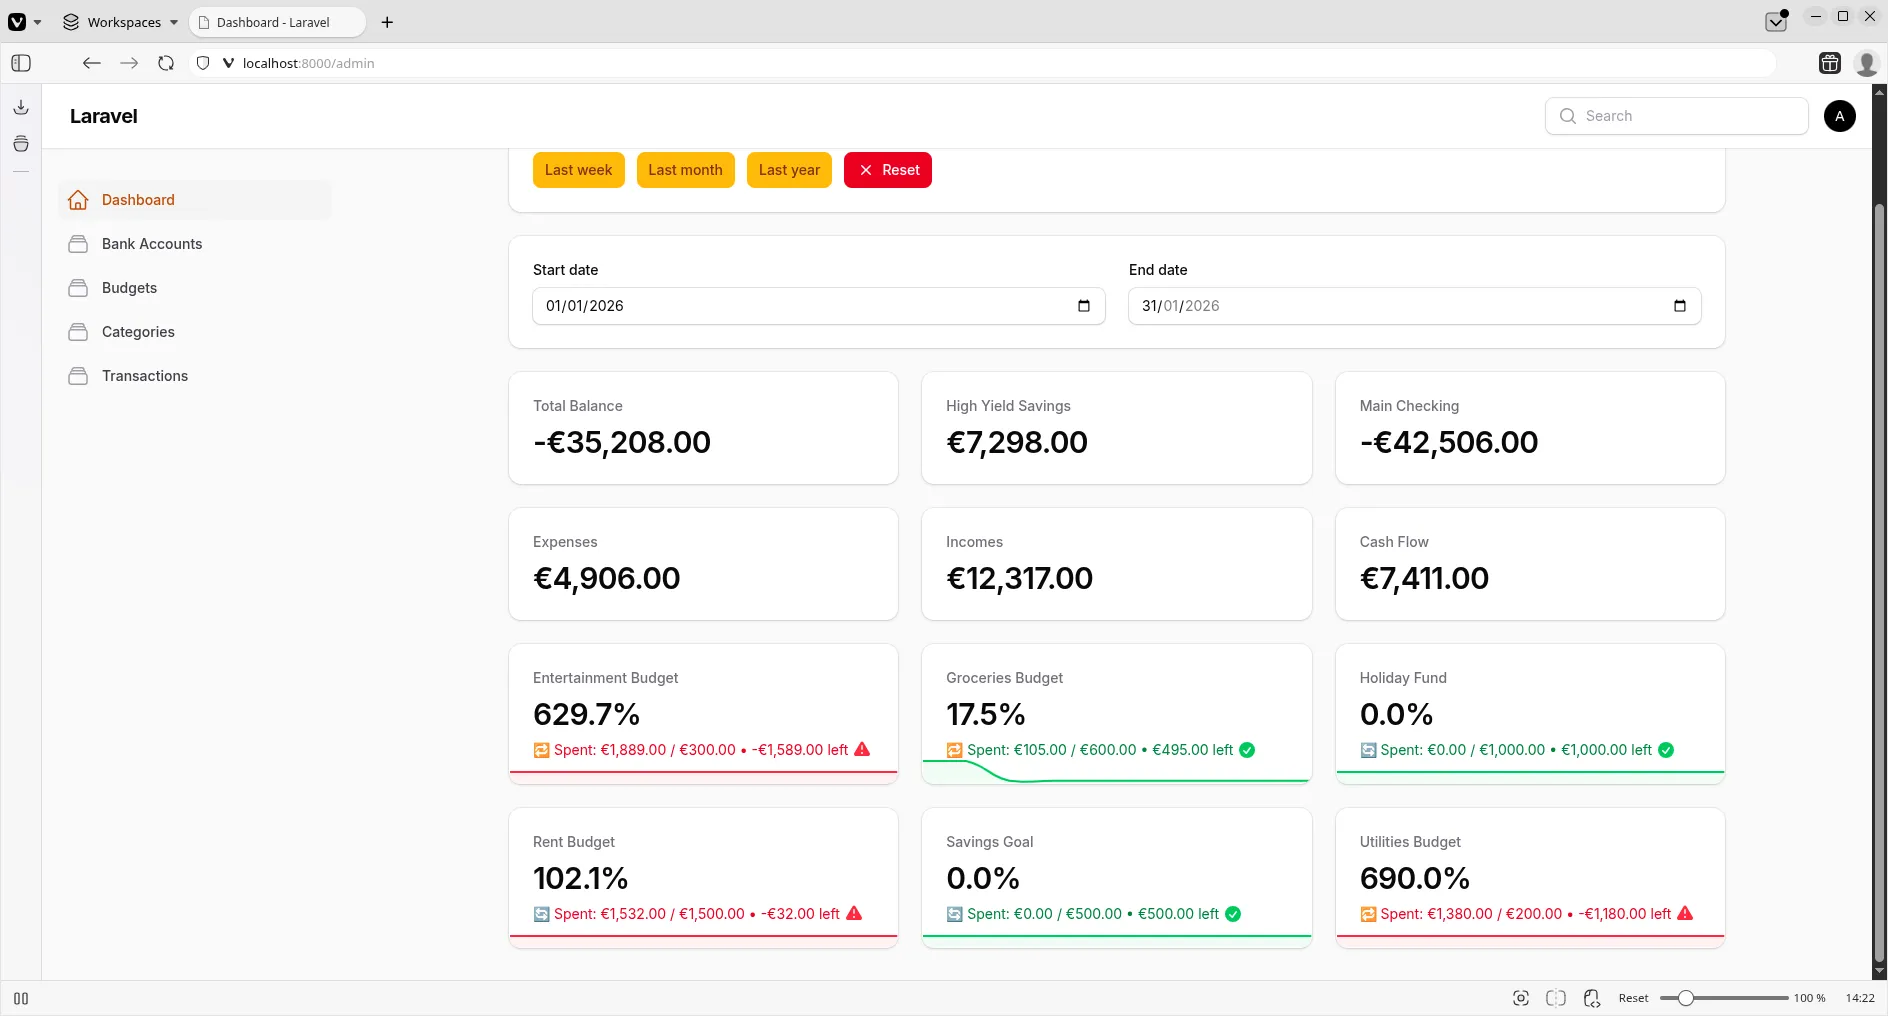
The logic involves handling ‘rollover’ vs ‘reset’ budgets and calculating the correct period amounts. View the commit to see the detailed calculation logic.
Creating a Separate Charts Page
To keep our main dashboard clean, let’s move more detailed visualisations to a dedicated “Charts” page.
First, create the page:
php artisan make:filament-page ChartsThen, let’s create a Pie Chart to visualize expenses by category:
php artisan make:filament-widget ExpensesPieChart --chartIn the ExpensesPieChart widget, we’ll group our expense transactions by category and aggregate the sums.
// app/Filament/Widgets/ExpensesPieChart.php

protected function getData(): array
{
    // ... query to group by category ...

    return [
        'datasets' => [
            [
                'label' => 'Expenses',
                'data' => $data->values()->toArray(),
                'backgroundColor' => [/* ... colors ... */],
            ],
        ],
        'labels' => $data->keys()->toArray(),
    ];
}
Finally, we register this widget on our new Charts page instead of the main dashboard.
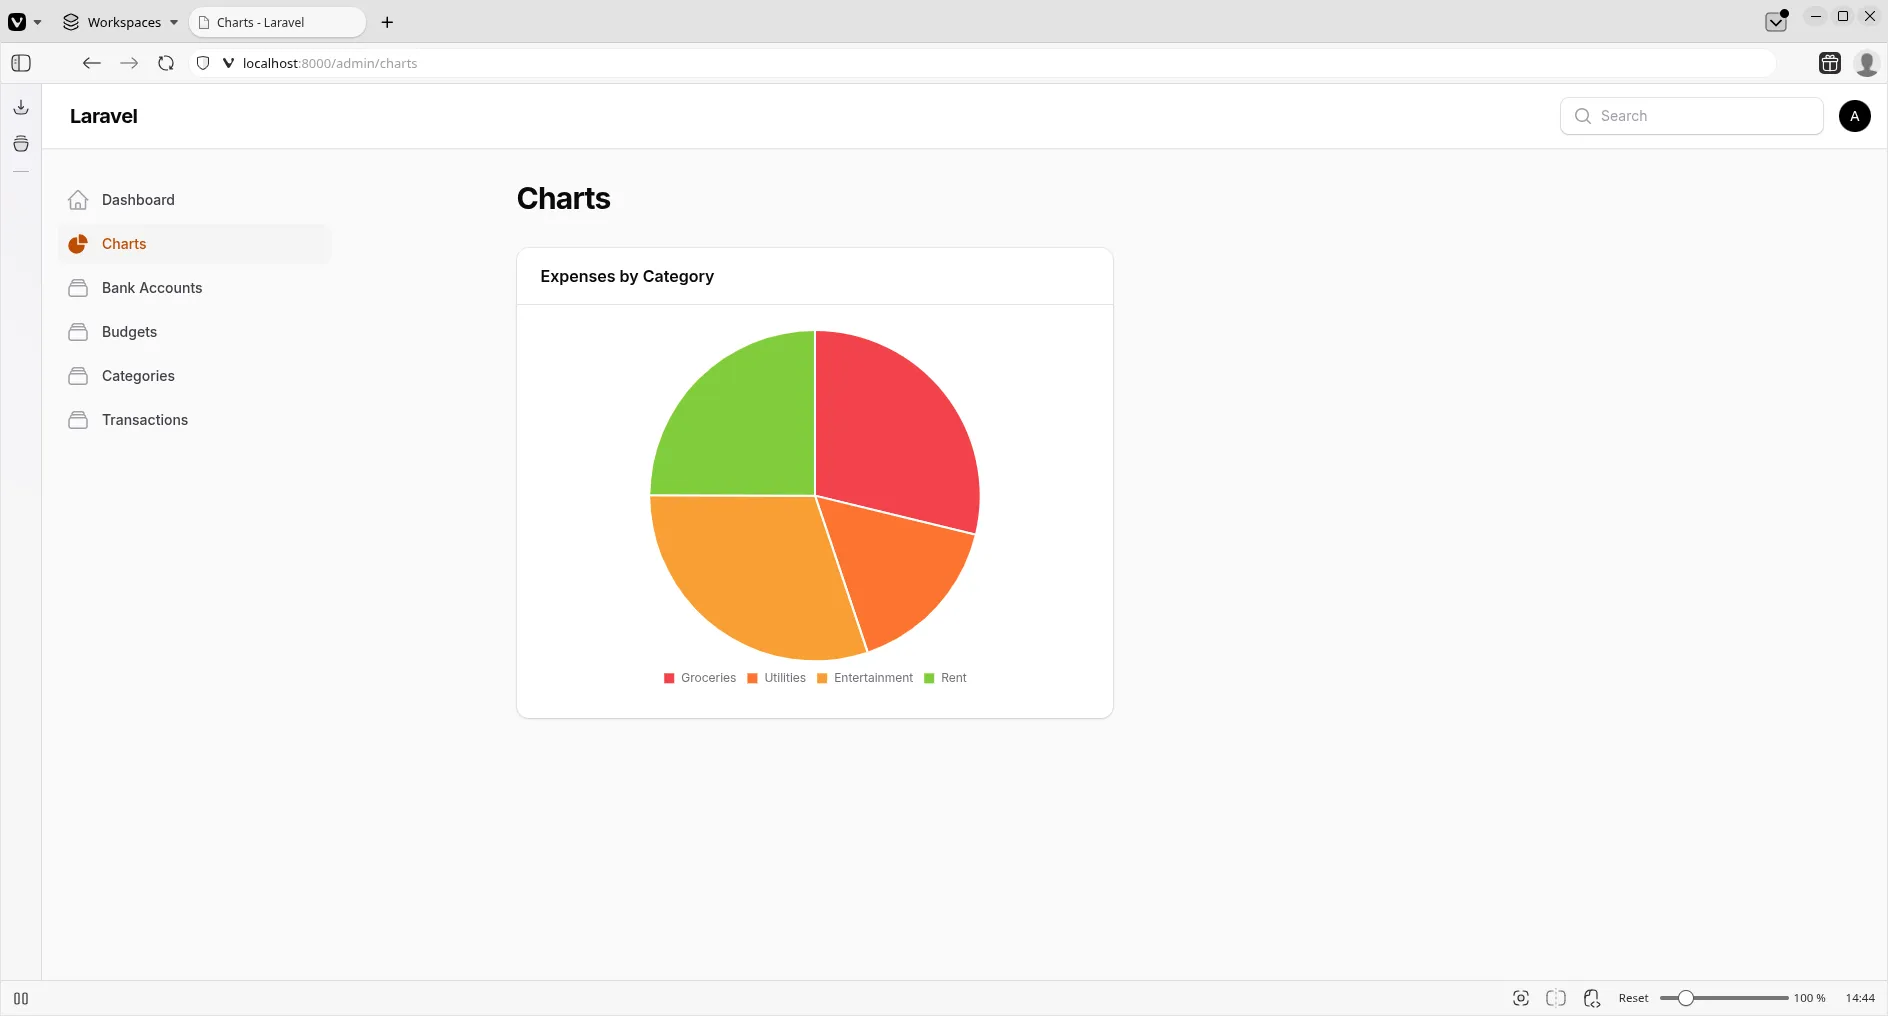
You can view the full implementation of the Charts page and the Pie Chart widget in this commit.
Conclusion
We now have a powerful, interactive dashboard that gives us real-time insights into our finances. We’ve learned how to create custom dashboards, implement global filters, and build dynamic widgets that react to user input.
Happy coding!